Service Map
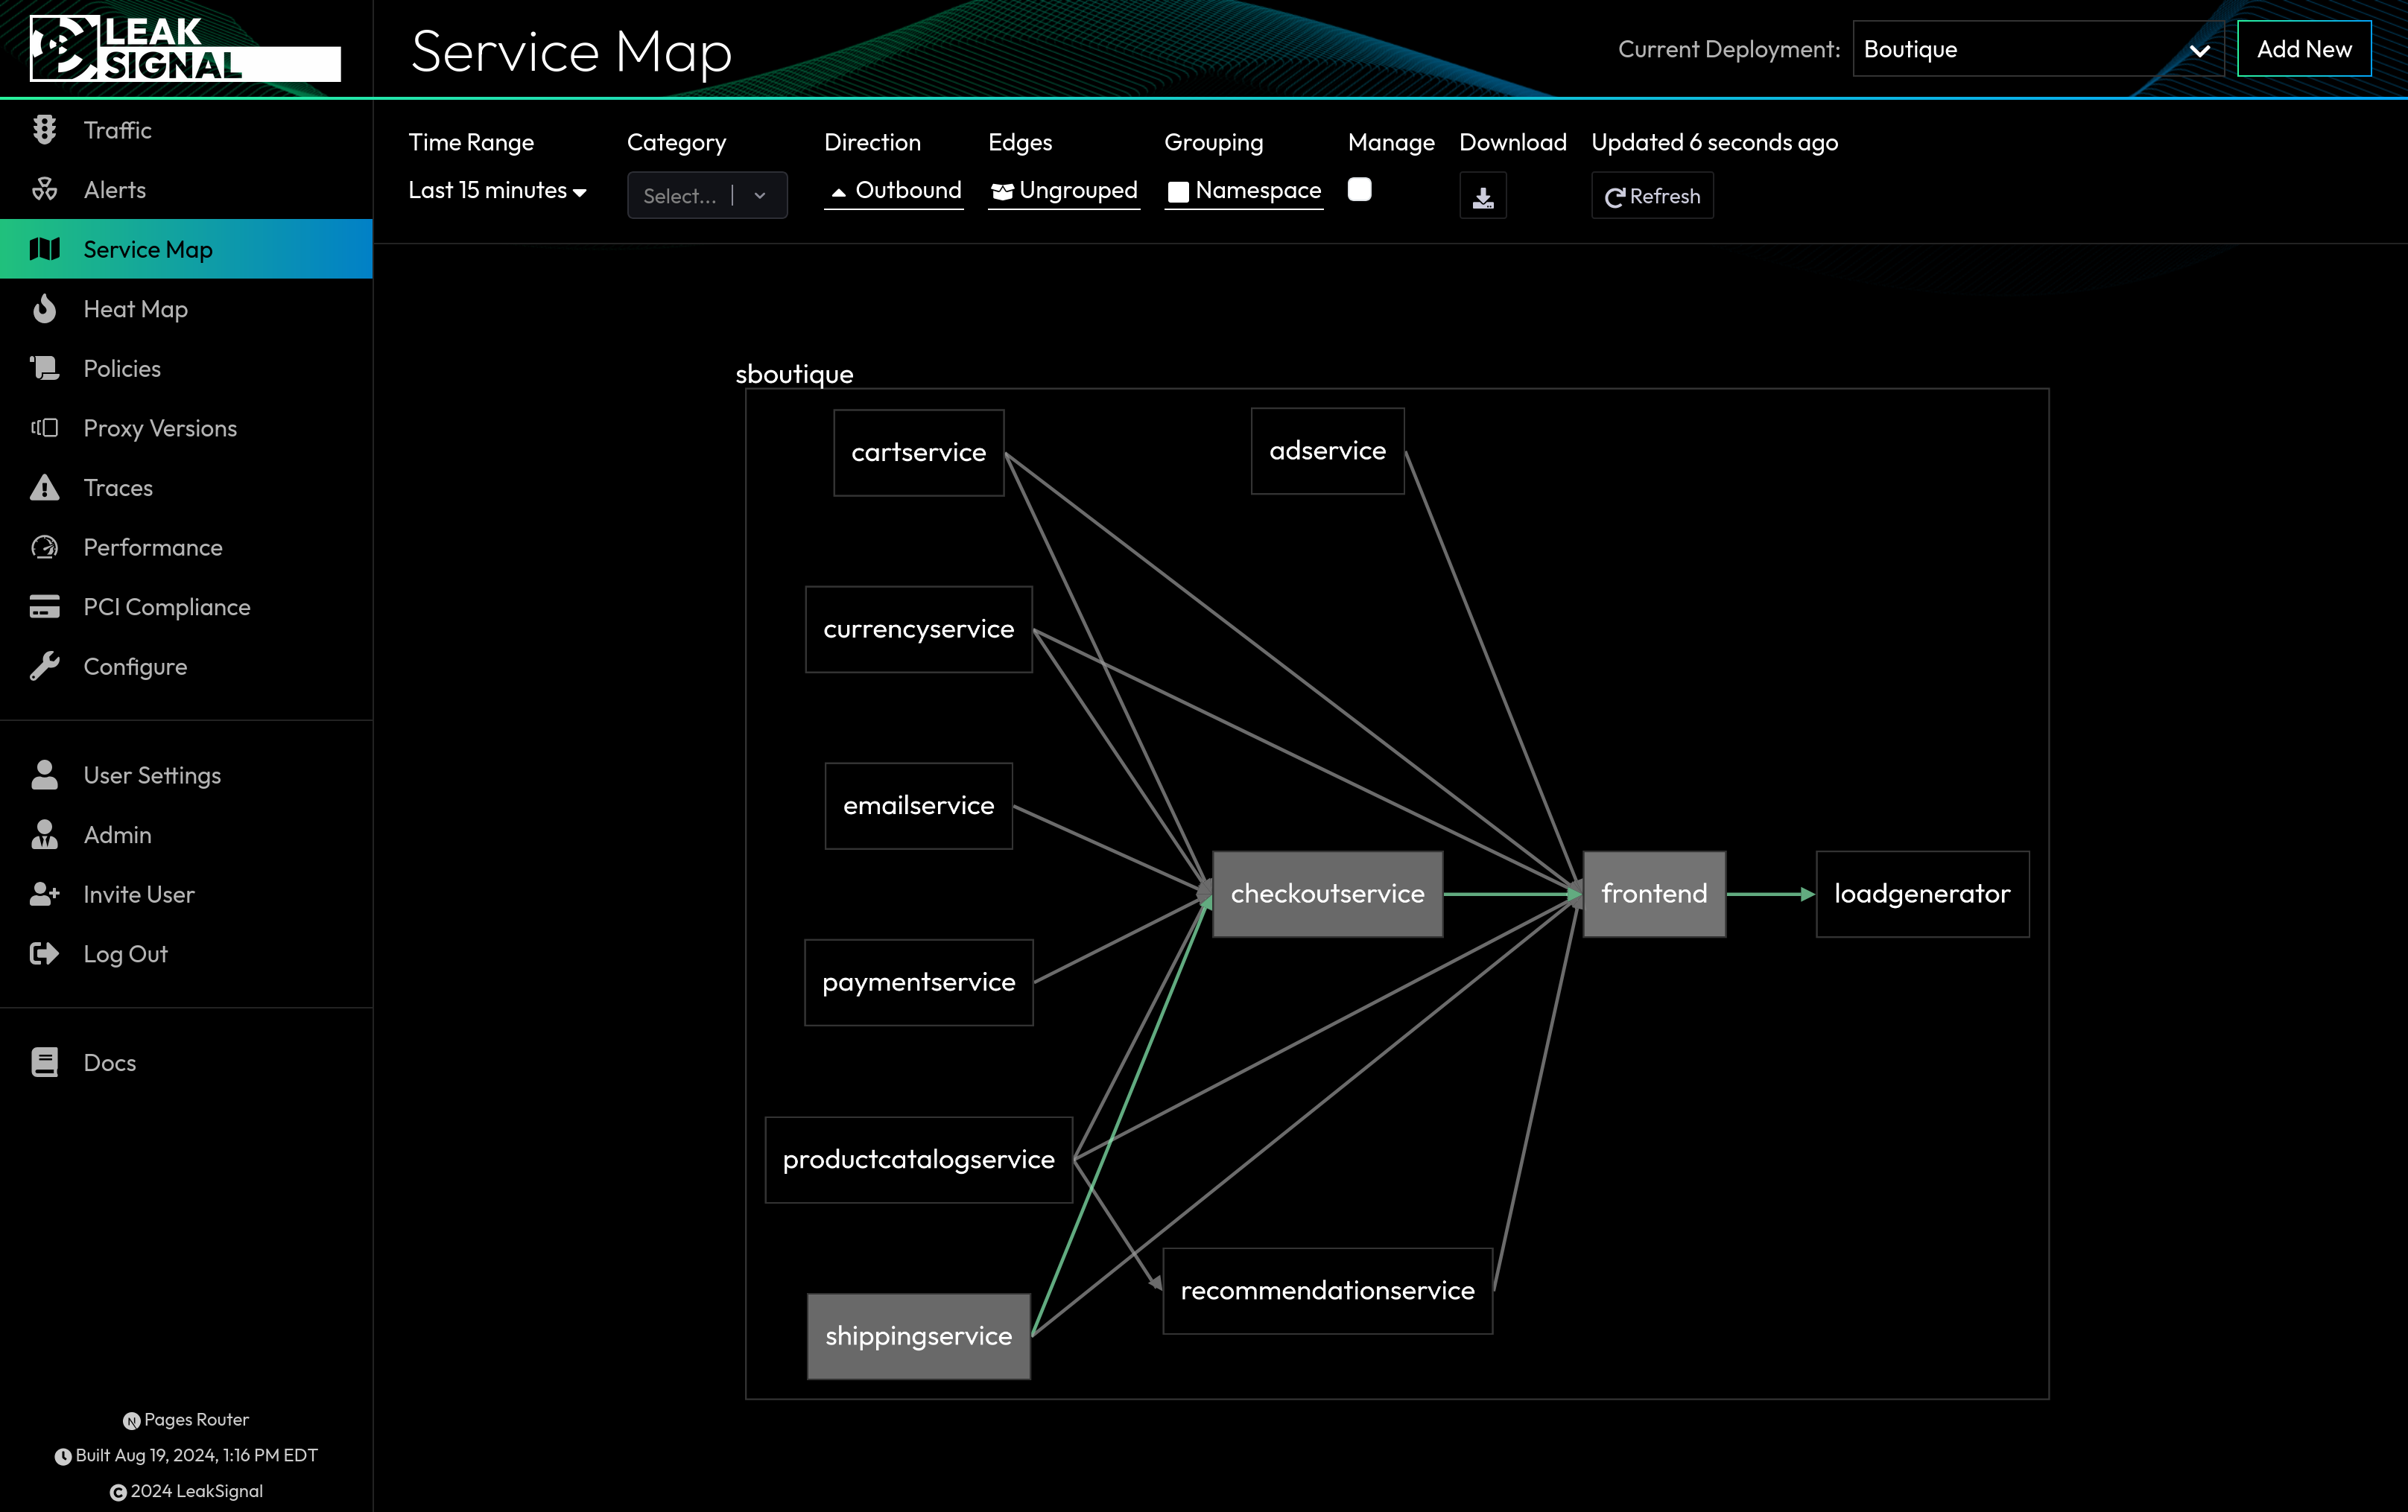
The Service Map displays a visual representation of all the services in a deployment as a directed graph (DAG).
Each node in the graph represents a service, and each edge represents a connection between services. Each edge is color-coded to represent the categories of PII being transmitted between services (with multiple edges if there are multiple categories of PII).
Selecting a PII Category from the filter will hide nodes which are not involved in the transmission of that category of data, as well as edges for other categories.
Clicking a node will zoom in on the node in the graph, and display a "shelf" menu with relevant service metadata as well as a list of traffic events related to that service.
Service Map Filters
| Filter | Description |
|---|---|
| Time Range | Specifies the time range for the data displayed in the Service Map. |
| PII Category | Filters the services displayed in the Service Map based on the categories of PII being transmitted. |
| Direction | Changes the displayed orientation of the graph to show inbound or outbound traffic. |
| Grouping | Changes the top-level grouping of nodes between Namespace, Service Account, or Manual. Manual allows the user to create their own categories in the user interface. |